Upstream natural gas emissions have received significant attention in the news due to concerns about high leakage rates from fracking and from piping infrastructure. This scope 3 emissions source is important to include in your emissions inventory to have more complete information when comparing across different energy options.
SIMAP now includes the ability to calculate scope 3 upstream emissions for natural gas, which are categorized as scope 3 category 3: fuel- and energy-related activities (FERA).
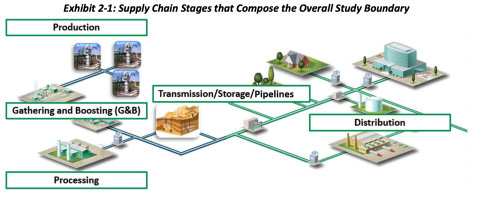
Source: NETL 2021
When selecting the appropriate upstream emissions factor, there are two main considerations:
- Your location (and therefore which natural gas basin your electricity comes from)
- Local leakage rates for natural gas
SIMAP uses a default FERA natural gas emissions factor that includes a weighted average across all US basins and a standard leakage rate of 2.3%. The leakage rate reflects loss of natural gas (which is mostly methane) across the supply chain. This can occur during natural gas fracking, from the distribution lines due to aging infrastructure, or anywhere else along the supply chain. Natural gas leakage is especially important to accurately estimate because natural gas is mostly methane (CH4), which is a potent greenhouse gas that has 28 times the warming effect as carbon dioxide.
This scope 3 natural gas emissions factor combines two data sources:
- Production emissions: SIMAP uses Burns & Grubert 2021 for a weighted average of production emissions
- All other life cycle emissions: SIMAP uses NETL 2021 for the remaining steps of the natural gas life cycle (i.e., gathering & boosting, processing, transmission compression, transmission storage, transmission pipeline, distribution)
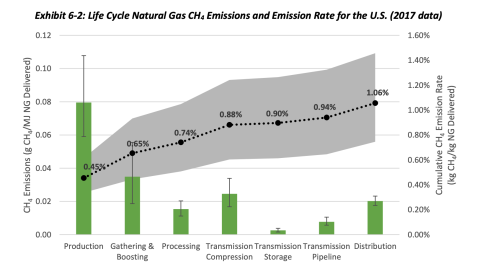
NETL 2021 study was used in SIMAP for US average emissions rates for all life cycle stages following production (gathering & boosting through distribution)
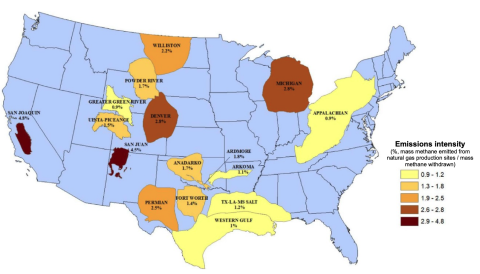
However, upstream production natural gas emissions factors can range significantly based on your specific gas basin and the leakage rate for your local infrastructure. The figures below from Burns & Grubert 2021 show the emissions intensity for natural gas basins in the US and the emissions intensities allocated to US states. Burns & Grubert 2021 was used in SIMAP to calculate a weighted average emissions rate for production emissions.
Natural gas upstream emissions intensity by natural gas basin in the US
Natural gas upstream emissions intensity allocated to US states
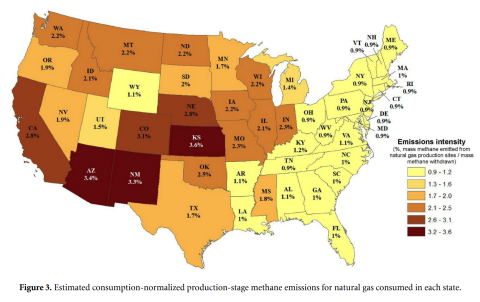
Source: Burns & Grubert 2021
Natural gas upstream emissions factors by US natural gas basin
We also calculated emissions factors that combine basin-specific production emissions (Burns & Grubert 2021) and US average emissions factors for all remaining life cycle stages (NETL 2021). These natural gas basin factors are not built into SIMAP, but you can customize your FERA natural gas emissions factor using our calculated basin-specific factors. In the table below, you can find upstream natural gas emissions factors by US natural gas basin.
State-specific emissions factors for upstream natural gas emissions (Source: Burns & Grubert 2021 for production emissions, NETL 2021 for remaining life cycle stages)
| State | kg CO2/MMBtu | kg CH4/MMBtu | kg N2O/MMbtu |
|---|---|---|---|
| AL | 6.72732 | 0.386133 | 0.000070864 |
| AR | 6.72732 | 0.384871 | 0.000070864 |
| AZ | 6.72732 | 0.904666 | 0.000070864 |
| CA | 6.72732 | 0.763722 | 0.000070864 |
| CO | 6.72732 | 0.838144 | 0.000070864 |
| CT | 6.72732 | 0.340189 | 0.000070864 |
| DE | 6.72732 | 0.339857 | 0.000070864 |
| FL | 6.72732 | 0.363721 | 0.000070864 |
| GA | 6.72732 | 0.367492 | 0.000070864 |
| IA | 6.72732 | 0.633593 | 0.000070864 |
| ID | 6.72732 | 0.602082 | 0.000070864 |
| IL | 6.72732 | 0.615412 | 0.000070864 |
| IN | 6.72732 | 0.644803 | 0.000070864 |
| KS | 6.72732 | 0.950905 | 0.000070864 |
| KY | 6.72732 | 0.413770 | 0.000070864 |
| LA | 6.72732 | 0.366865 | 0.000070864 |
| MA | 6.72732 | 0.369333 | 0.000070864 |
| MD | 6.72732 | 0.339857 | 0.000070864 |
| ME | 6.72732 | 0.339857 | 0.000070864 |
| MI | 6.72732 | 0.441910 | 0.000070864 |
| MN | 6.72732 | 0.512239 | 0.000070864 |
| MO | 6.72732 | 0.655341 | 0.000070864 |
| MS | 6.72732 | 0.546757 | 0.000070864 |
| MT | 6.72732 | 0.632448 | 0.000070864 |
| NC | 6.72732 | 0.371189 | 0.000070864 |
| ND | 6.72732 | 0.632448 | 0.000070864 |
| NE | 6.72732 | 0.756976 | 0.000070864 |
| NH | 6.72732 | 0.343635 | 0.000070864 |
| NJ | 6.72732 | 0.339857 | 0.000070864 |
| NM | 6.72732 | 0.880693 | 0.000070864 |
| NV | 6.72732 | 0.553828 | 0.000070864 |
| NY | 6.72732 | 0.339857 | 0.000070864 |
| OH | 6.72732 | 0.339857 | 0.000070864 |
| OK | 6.72732 | 0.693168 | 0.000070864 |
| OR | 6.72732 | 0.570714 | 0.000070864 |
| PA | 6.72732 | 0.339857 | 0.000070864 |
| RI | 6.72732 | 0.339857 | 0.000070864 |
| SC | 6.72732 | 0.371189 | 0.000070864 |
| SD | 6.72732 | 0.581429 | 0.000070864 |
| TN | 6.72732 | 0.339857 | 0.000070864 |
| TX | 6.72732 | 0.527259 | 0.000070864 |
| UT | 6.72732 | 0.474899 | 0.000070864 |
| VA | 6.72732 | 0.375473 | 0.000070864 |
| VT | 6.72732 | 0.339849 | 0.000070864 |
| WA | 6.72732 | 0.632448 | 0.000070864 |
| WI | 6.72732 | 0.640571 | 0.000070864 |
| WV | 6.72732 | 0.339857 | 0.000070864 |
| WY | 6.72732 | 0.387121 | 0.000070864 |
Basin-specific emissions factors for upstream natural gas emissions (Source: Burns & Grubert 2021 for production emissions, NETL 2021 for remaining life cycle stages)
| Natural gas basin name | kg CO2/MMBtu | kg CH4/MMBtu | kg N2O/MMBtu |
|---|---|---|---|
| US average | 6.72732 | 0.526665 | 0.00007086 |
| Anadarko - Conventional | 7.50724 | 0.614447 | 0.00007086 |
| Anadarko - Shale | 6.78924 | 0.430566 | 0.00007086 |
| Anadarko - Tight | 8.92210 | 0.821636 | 0.00007086 |
| Appalachian - Shale | 4.74086 | 0.236973 | 0.00007086 |
| Arkla - Conventional | 4.85700 | 0.679841 | 0.00007086 |
| Arkla Shale | 4.30795 | 0.267404 | 0.00007086 |
| Arkla Tight | 4.44521 | 0.284238 | 0.00007086 |
| Arkoma - Conventional | 8.06685 | 1.208822 | 0.00007086 |
| Arkoma - Shale | 7.71841 | 0.593728 | 0.00007086 |
| East Texas - Conventional | 7.32774 | 0.562002 | 0.00007086 |
| East Texas - Shale | 7.14824 | 0.461644 | 0.00007086 |
| East Texas - Tight | 6.57807 | 0.495313 | 0.00007086 |
| Fort Worth - Shale | 7.47556 | 0.489485 | 0.00007086 |
| Green River - Conventional | 5.11041 | 0.262872 | 0.00007086 |
| Green River - Tight | 5.42717 | 0.342510 | 0.00007086 |
| Gulf - Conventional | 6.22963 | 0.426034 | 0.00007086 |
| Gulf Shale | 6.11349 | 0.433156 | 0.00007086 |
| Gulf Tight | 5.93399 | 0.403372 | 0.00007086 |
| Permian - Conventional | 5.99734 | 0.387833 | 0.00007086 |
| Permian - Shale | 6.92651 | 0.410494 | 0.00007086 |
| Piceance - Tight | 5.14209 | 0.604087 | 0.00007086 |
| San Juan - CBM | 9.10160 | 0.768544 | 0.00007086 |
| San Juan - Conventional | 10.51647 | 1.549390 | 0.00007086 |
| South Oklahoma - Shale | 7.41221 | 0.411789 | 0.00007086 |
| Strawn Shale | 7.12712 | 0.479126 | 0.00007086 |
| Uinta - Conventional | 6.17684 | 0.396898 | 0.00007086 |
| Uinta Tight | 6.31410 | 0.502435 | 0.00007086 |
| Alaska Offshore | 4.60359 | 0.201362 | 0.00007086 |
| GoM Offshore | 4.60359 | 0.203305 | 0.00007086 |
| Associated Gas | 14.45486 | 0.554232 | 0.00014173 |
You can customize your upstream natural gas emission factors using the following steps:
- Go to the Data Entry tab > Emission factors page
- From the drop-downs, make the following selections: Scope 1 > On-campus stationary sources > Natural gas
- Now when you select the last drop-down, FERA emission factors will appear for all emission factor types
- Select a FERA emissions factor, enter your custom emissions factor in the text field for all applicable years, and click the green 'save' button at the end. Repeat for other emissions factors as needed.
Which natural gas FERA emissions factors are available in SIMAP?
There are three types of upstream emissions factors for natural gas in SIMAP: CO2, CH4, and N2O. These cover all major greenhouse gas emissions associated with natural gas production, processing, and distribution.
Although NOx emissions are generated from upstream natural gas, we do not yet have those emissions factors calculated and populated in SIMAP. If you have a custom upstream natural gas emissions factor for NOx, there is a blank field on the emissions factors page where you can enter your custom factor.
Sources
Burns & Grubert 2021. Attribution of production-stage methane emissions to assess spatial variability in the climate intensity of US natural gas consumption. Environmental Research Letters 16: https://doi.org/10.1088/1748-9326/abef33
Omara et al. 2018. Methane Emissions from Natural Gas Production Sites in the United States: Data Synthesis and National Estimate. Environmental Science & Technology 52: 12915 - 12925.
NETL (National Energy Technology Laboratory) 2021. Industry partnerships and their role in reducing natural gas supply chain greenhouse gas emissions - Phase 2.