Where do I view the SIMAP food report?
You can view the SIMAP food report on the Reports tab by selecting 'Food report' from the drop-down menu.
What information does the food report include?
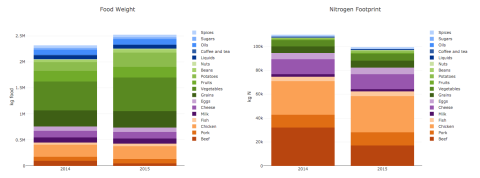
The food report has two graphs showing the weight and footprint of your food purchases over time. Radio buttons allow you to view either the carbon footprint or nitrogen footprint. A table below the graphs provides the detailed results by food category for the selected footprint. The figure below is an example data set generated by the food report. This example data set shows the effect of increasing plant-based purchases and decreasing animal-based purchases over time.
Has anything else in SIMAP changed with this new food report?
Yes! We moved a detailed table about the food calculations from the Results tab over to the Reports tab. Now, the Results tab shows basic information about your food results (i.e., the weight and footprint of your food purchases by food category). The food report now shows additonal details and steps for calculating the food nitrogen footprint (see below).
What do the column headings mean on the detailed food nitrogen footprint table?
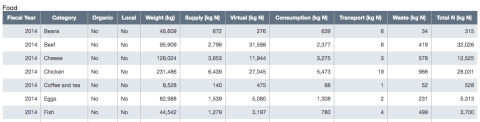
The columns show additional data and calculations that are used to calculate your total food nitrogen footprint. The definitions are:
- Weight (kg) = Weight of food purchased by food category in kilograms
- Supply (kg N) = Weight of food purchased by food category, converted into kilograms of nitrogen
- Virtual N (kg N) = Nitrogen released to the environment during the food production process. This is calculated as (Supply kg N) * (Food N footprint factor).
- Consumption (kg N) = Nitrogen contained in food that is consumed. This is calculated as (Supply kg N) - (Food waste N).
- Transport (kg N) = Nitrogen emissions released from transporting the food. This is calculated as (Number of trips) * (Average food miles) * (Transport N emissions factor).
- Waste (kg N) = Nitrogen contained in food waste. This is calculated as (Supply kg N) * (Food waste %).
- Total N (kg N) = Total food nitrogen footprint. This is calculated as (Virtual kg N) + (Transport kg N) + (Waste kg N).
The factors used in these calculations can be viewed and customized on the food conversion factors page on the Data Mgmt tab. The factors that can be customized with a Tier 1 subscription are:
- Nitrogen content of food (ratio)
- Conventional virtual N factor, which is the food nitrogen footprint factor (kg N loss / kg N food)
- Carbon footprint factor (kg eCO2 / kg food)
- Carbon footprint factor for local food (kg eCO2 / kg food)
- Nitrogen transport emissions factor (kg N / mile)
- Food transport distance (miles)
- Local food transport distance (miles)
- Food waste (ratio)
- Truck capacity (kg) - This is used to calculate the number of delivery trips.
How is the food carbon footprint calculated?
The carbon footprint of food is calculated by multiplying the food weight by its emission factor. The equation is:
Food carbon footprint = Food weight * CO2e emissions factor
There are separate food carbon emissions factors for conventional food and local food. The local food carbon footprint factors are adjusted to account for reduced emissions from final transportation only. You can see the full list of food emission factors on the Data Entry Tab > Food Conversion Factors page.
How can I use this food report to information my campus' food sustainability goals?
The food report allows you to track progress over time for the weight, carbon footprint, and nitrogen footprint of the food purchased on your campus.